May 07, 2021 / by Trustworthy AI team
Keeping score: Evaluating safety metrics for autonomous vehicles
We perform a case study on metric evaluation using the CARLA simulator, a pre-release version of the Autoware autonomous driving stack, and the Responsibility Sensitive Safety (RSS) framework. Using the TrustworthySearch API, we create a diverse dataset of simulations which includes crashes. We then use this dataset to evaluate how four different configurations of RSS parameters affect the performance of RSS.
Disengaging from disengagements
One of the world’s first automobile accidents occurred in 1891 when a car crashed into a hitching post used for “parking” horses [Scott, 1960]. Since then, manufacturers, insurers, and regulators have made increasingly sophisticated tools to identify risky drivers and activate safety systems which prevent accidents [Wishart et al, 2020]. Just like in the 1890’s, today’s mobility landscape is rapidly changing – this time because of the development of autonomous vehicles (AVs). Like the hitching post in the world’s first car crash, remnants of old transportation modes —human-operated vehicles— represent obstacles to achieving the dream of fully autonomous driving.
Around the same time cars hit the road 100 years ago, professional baseball became America’s pastime, and fans began quantifying the performance of players through statistics like batting average [Albert, 2010]. Eventually, baseball metrics evolved into more sophisticated quanities like wins-above-replacement, broadly coined “Sabermetrics,” [Hakes and Sauer, 2006]. What do baseball statistics have to do with AVs? Like the early days of baseball, the statistics we currently collect about AVs are flawed indicators of performance, and the industry is still in the process of developing more sophisticated ones.
The most common publically available AV metrics are the California DMV disengagement reports. These include the “disengagement rate,” which ostensibly measures the frequency of safety driver interventions. Unfortunately, the definition of a disengagement varies from company to company, and disengagements are confounded by the variation of testing conditions which different manufacturers use. There is broad industry consensus that disengagement reports unfortunately provide little meaningful signal about the progress of AV technology [Hawkins, 2020].
Since demonstrating safety is a primary barrier to the deployment of AVs, manufacturers have sought less opaque ways of quantifying AV technology and preventing certain types of accidents. Recently proposed safety frameworks, such as Responsibility Sensitive Safety (RSS) [Shalev-Shwartz et al, 2017] and the Safety Force Field (SFF) [Nister et al, 2019], argue that an AV should maintain a safe distance from other traffic so that it can prevent a collision if another driver behaves within the bounds of “reasonably foreseeable worst-case assumptions” [Weast et al, 2021]. In practice, the challenge is in defining what is reasonable. The tension comes from the need to balance safety with performance in traffic situations: we want safety metrics which strongly correlate with ground-truth measures of danger like crash rates (capturing safety) without being overly conservative and labeling every situation as dangerous (capturing performance).
Outline
In this post we describe methodologies to evaluate AV safety metrics. The goal is to understand how variations in assumptions about other drivers’ behaviors affect the performance of these metrics. Our experiments use the CARLA driving simulator, RSS, and (a pre-release version) of Autoware — all open-source tools for AV development. First, via the TrustworthySearch API, we create a large simulated dataset of autonomous vehicle crashes in order to augment typically available data which demonstrates only safe driving. Next, we define continuous metrics derived from four region-specific RSS configurations and compute their correlations to the degree of danger present within scenarios. Because RSS utilizes two separate metrics in its safety model, we explore how composite metrics might improve our understanding of RSS configuration performance. Finally, we evaluate the ability of these RSS-derived metrics to act as preemptive predictors of dangerous events through the lens of binary classification.
What’s the worst that could happen?
RSS is an autonomous vehicle safety framework developed by Intel and Mobileye that formalizes common-sense defensive driving as a set of mathematical formulas and logical rules. The RSS model indicates when a dangerous situation could occur and prescribes steering and braking responses which mitigate this danger. The prevalence of danger is evaluated with respect to worst-case possible actions of the other traffic, which depends on the scenario, road conditions, local norms, and the types of vehicles involved. For example, driving that is considered normal in congested Boston traffic might be dangerous in the suburbs of Phoenix.
To address these local variations in traffic behavior, safety regulators and manufacturers must configure RSS using a set of parameters that can be fit to driving data from different operational design domains (see Figure 1).
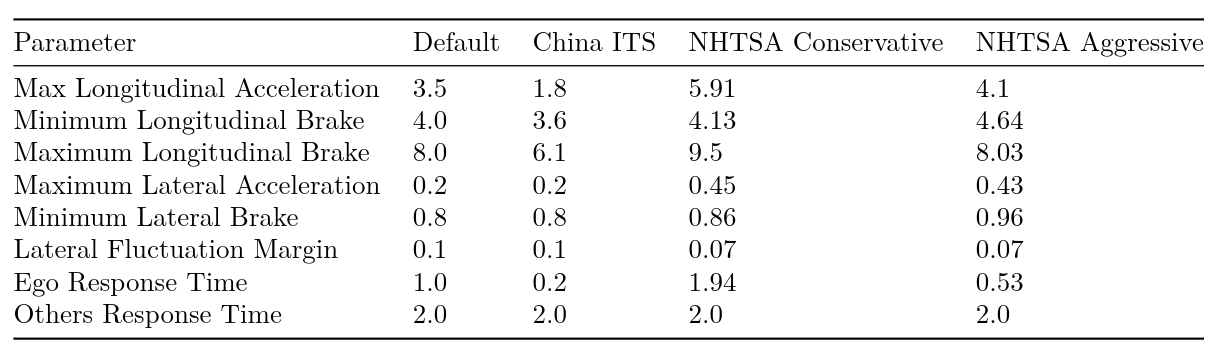
For example, the parameters fit from a Chinese dataset have a much lower max acceleration parameter compared to the U.S. derived counterparts (1.8 vs 5.91 m/s^2) due to higher road congestion. All of these RSS configurations tend to do well at detecting dangerous events. The problem is that they also detect danger in events that do not lead to crashes or near misses. Our goal in this experiment is to determine which of these four configurations is best suited to capture the performance of a pre-release version of the Autoware stack on a US highway driving scenario. We consider both the correlation of RSS-derived statistics with near-miss events, and the ability to predict such events before they occur. As mentioned earlier, we want to appropriately balance safety (detecting danger when it is present) with performance (minimizing false alarms). Since dangerous events are rare in typical datasets, we utilize TrustworthySearch to efficiently identify near-miss scenario executions. Before continuing with the experiments, we’ll first define near-miss events and then discuss the RSS-derived statistics which we’ll use to evaluate RSS configurations.
Ranking dangerous events
To identify near-miss events, we utilize the minimum time-to-collision over a simulation as a continuous measure of potential danger. Time-to-collision (TTC) is a metric designed to capture and rank “traffic events according to the danger that they generate” [Hayward, 1972]. At each instant during a drive, TTC is the amount of time that would pass until the AV and another car would collide if they continued at their current velocity and heading. If TTC is small, there is potential for conflict between the AV and the other vehicle (if TTC is zero then a collision has occurred). Every simulation has a moment in time over which TTC attains its minimum. We use this minimum TTC (min-TTC) to represent the relative potential for danger in that simulation.
As alluded to above, RSS uses assumptions about other road users’ behaviors as well as the AV’s capabilities to determine whether a given scenario is dangerous and what an appropriate response would be. There are multiple signals output from RSS: we focus on the “is_safe” indicator and the “recommended_action” output. For every moment in time, the “is_safe” indicator outputs whether RSS believes the ego-vehicle is safe, and the “recommended_action” outputs recommendations for steering and brake inputs. Typically, RSS is used to monitor and correct the actions of AV controllers. Here, we instead use these intermediate values as a basis for comparing the four different RSS configurations. We design two continuous metrics derived from the binary RSS output that are defined over a 4-second time window preceding the moment in time at which min-TTC occurred. These metrics are:
– RSS Safe Percent: What percent of the time window did RSS say the situation was safe?
– Proper Response Gap: How different were the actual actions of the vehicle from the RSS-recommended actions during the time window? Notice that the ego-vehicle didn’t actually receive these recommendations so any dangerous event is a result of the AV black box decision and not the RSS model itself.
Now let’s evaluate how different RSS configurations affect the correspondence of these metrics with the relative danger of the scenario as measured by min-TTC.
Experiment 1: Correlation analysis
Intuitively, we want RSS-derived metrics to indicate danger only when near-misses occur (which, in this case, means when min-TTC is small). One way to evaluate this is to measure the Pearson correlation between RSS-derived metrics and min-TTC (see Figure 2). Our dataset is well-suited to this task, since it contains a full range of safe, near-crash, and crash simulations, meaning that it contains a range of small, medium, and large min-TTCs.
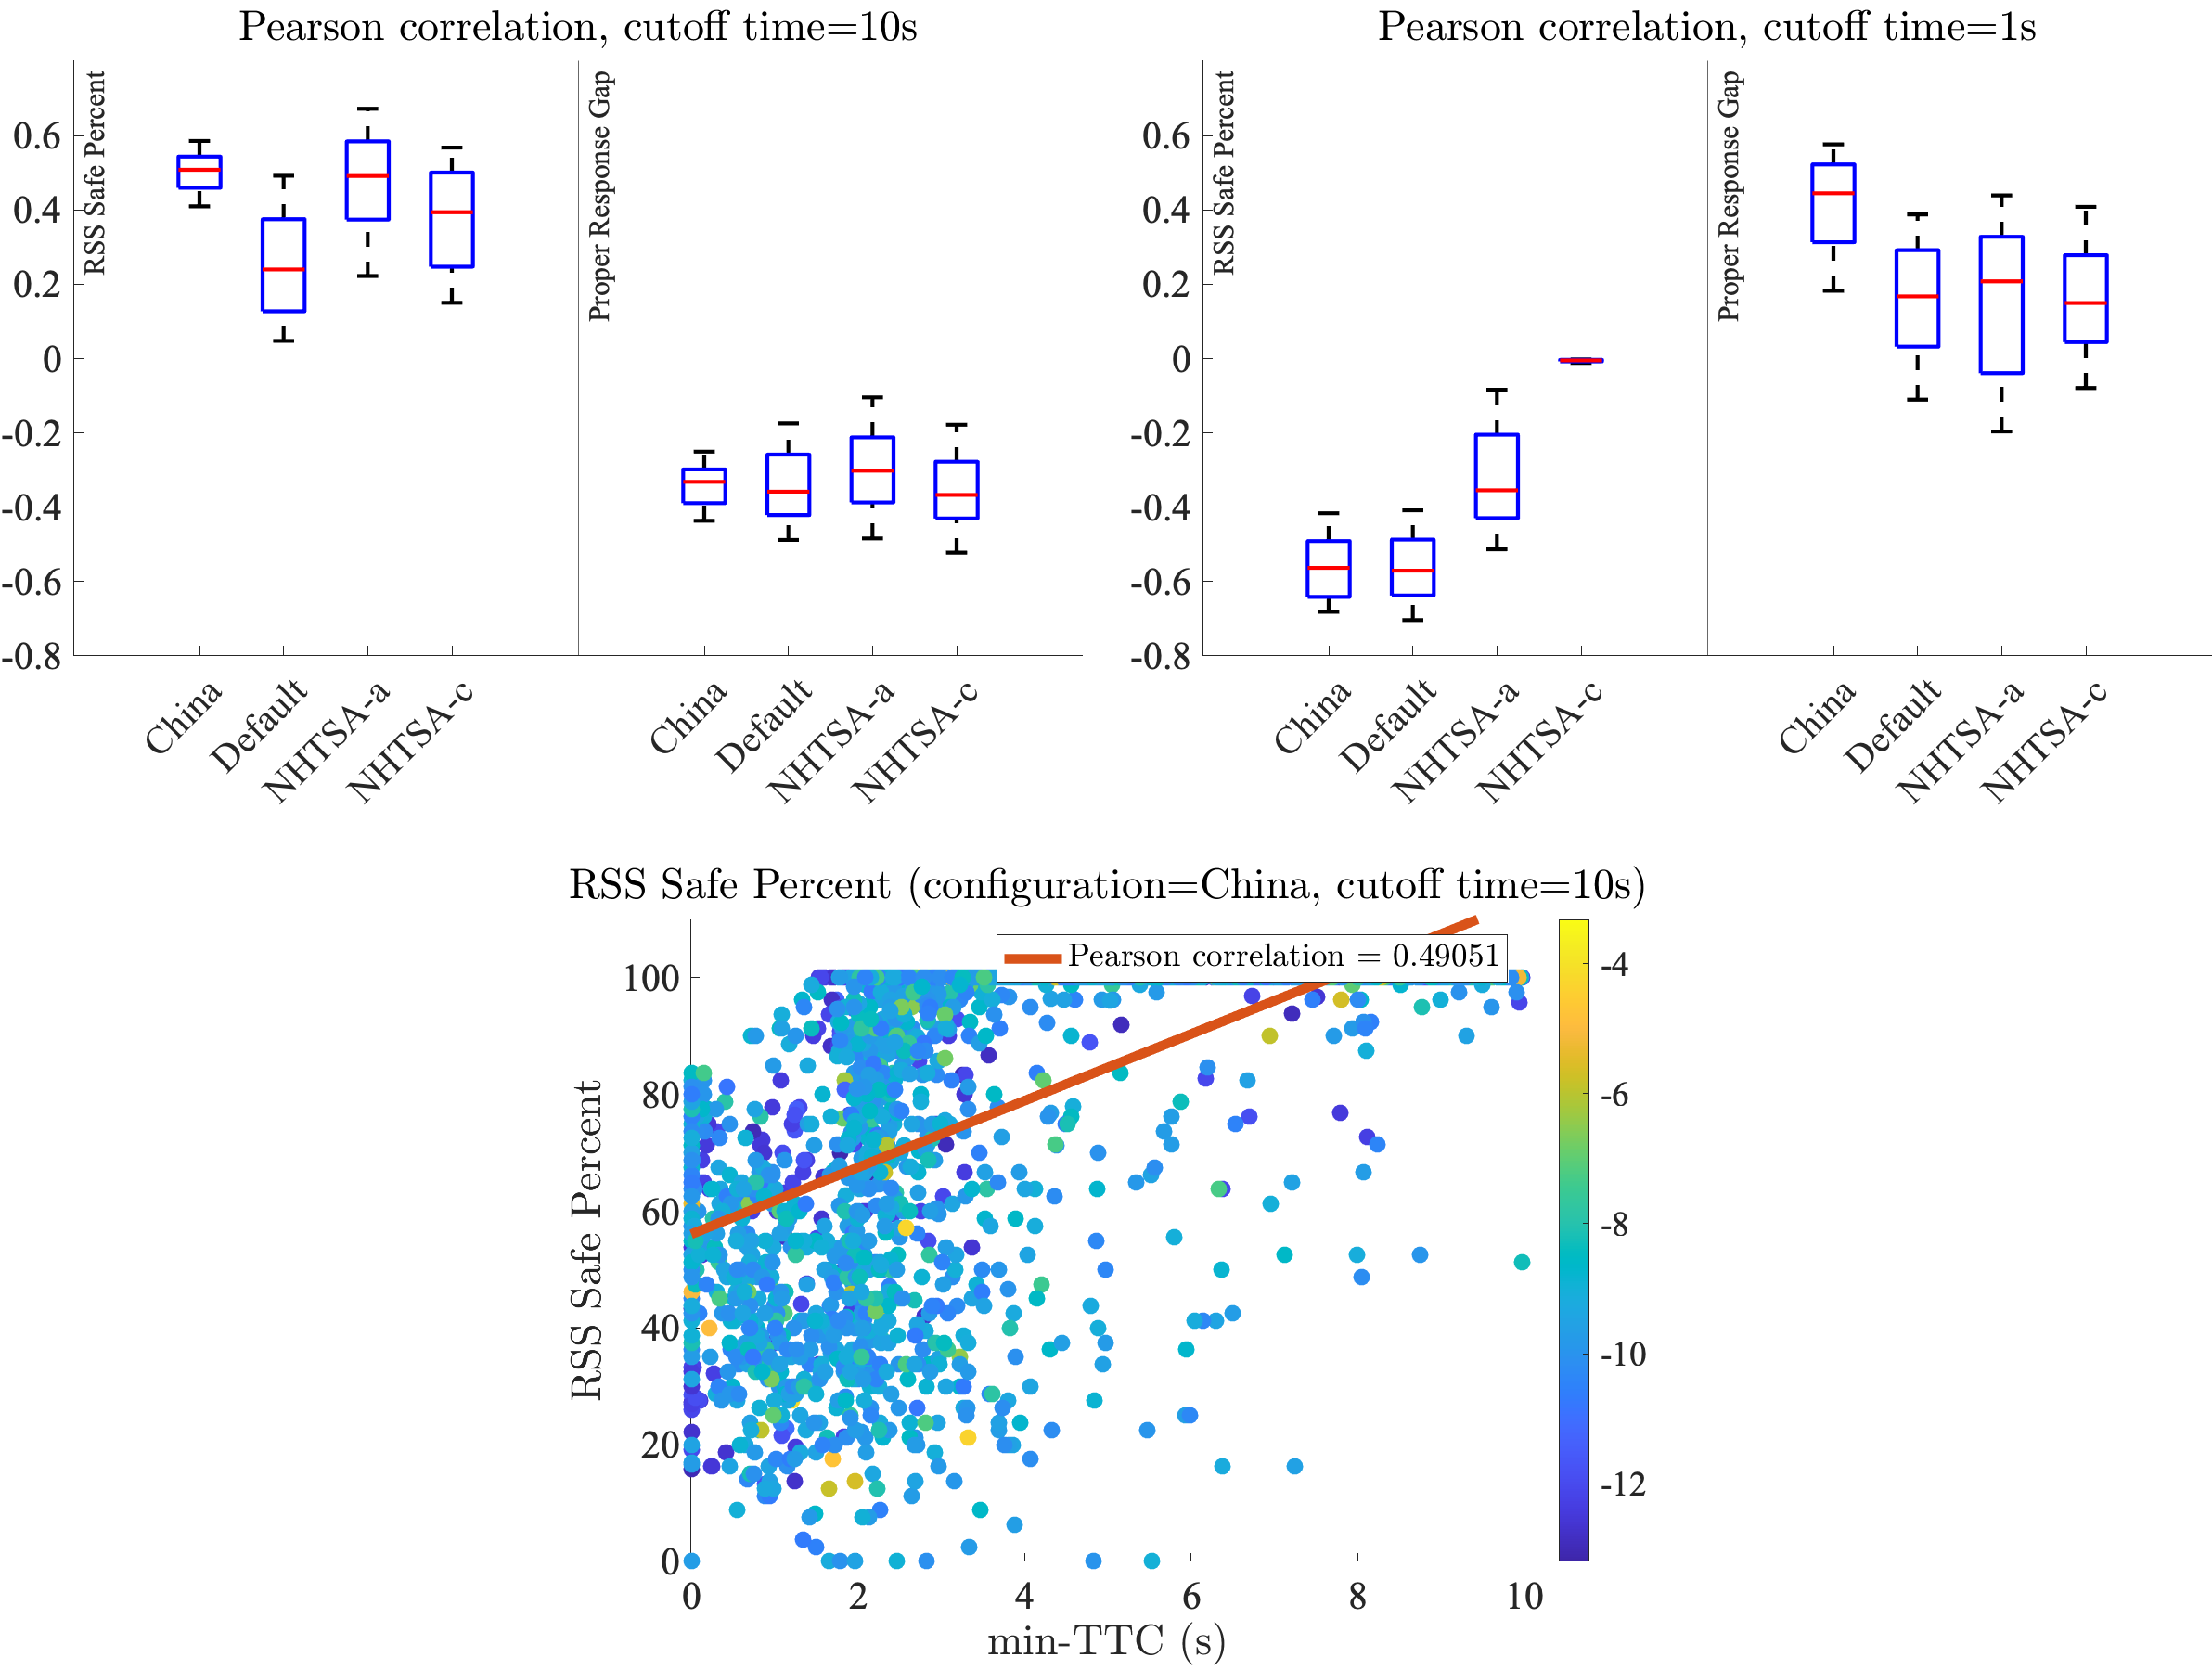
In Figure 2, we see that for all RSS configurations, there is some correlation with collisions (low min-TTC), albeit relatively low. Furthermore, the sign of this correlation flips depending on the regime of data we’re looking at. For example, RSS Safe Percent has a positive correlation with min-TTC when distinguishing between all simulations with min-TTC between 0 and 10s, but a negative correlation when we subset the data and only look at the simulations with 0 to 1s min-TTC.
Let’s take a look at some actual footage from the simulations in the case where the RSS Safe Percent was low and the vehicle crashed (a correct diagnosis of danger), and the case where RSS Safe Percent was high but the vehicle also crashed (a false sense of safety). These situations are shown in Figure 3.
In these two examples, we see that the RSS Safe Percent metric can fail to consistently rank the danger of low min-TTC scenarios. While it is generally true that large RSS Safe Percent measurements indicate that a near-miss is unlikely to occur, it is hard to disambiguate the severity of near-misses using RSS Safe Percent.
What about Proper Response Gap? To recap, the Proper Response Gap is the difference between what the vehicle actually does and what RSS thinks it should do. In both scenarios of Figure 6, the Proper Response Gap was high (Left: 1063.7 and Right: 1721.8 m/s^2). This implies that the Proper Response Gap was able to recognize that second situation was dangerous even though RSS Safe Percent did not.
In the right picture of Figure 3, we’ve seen that in a dangerous situation, it is possible for RSS Safe Percent to be high (a false sense of safety) while Proper Response Gap is high (a good alarm). Depending on the vehicle’s driving behavior, it is also possible to have the opposite occur in a dangerous situation: RSS Safe Percent is low and the vehicle obeys RSS’s recommendation, which makes Proper Response Gap low. In summary, both metrics are complementary to each other and capture different aspects of the situation. Can we unify them into a single score that performs better than each of them individually? Let’s take a look at this next.
Experiment 2: Combining metrics
We’d like to combine the RSS Safe Percent and Proper Response Gap metrics in order to more accurately quantify the ability of RSS to capture dangerous situations. In this post, we consider the simplest possible model: a linear combination. To do this, we train a linear regressor to combine both RSS Safe Percent and Proper Response Gap into a score that regresses onto min-TTC. Figure 4 shows how the new combined metric correlates with min-TTC.
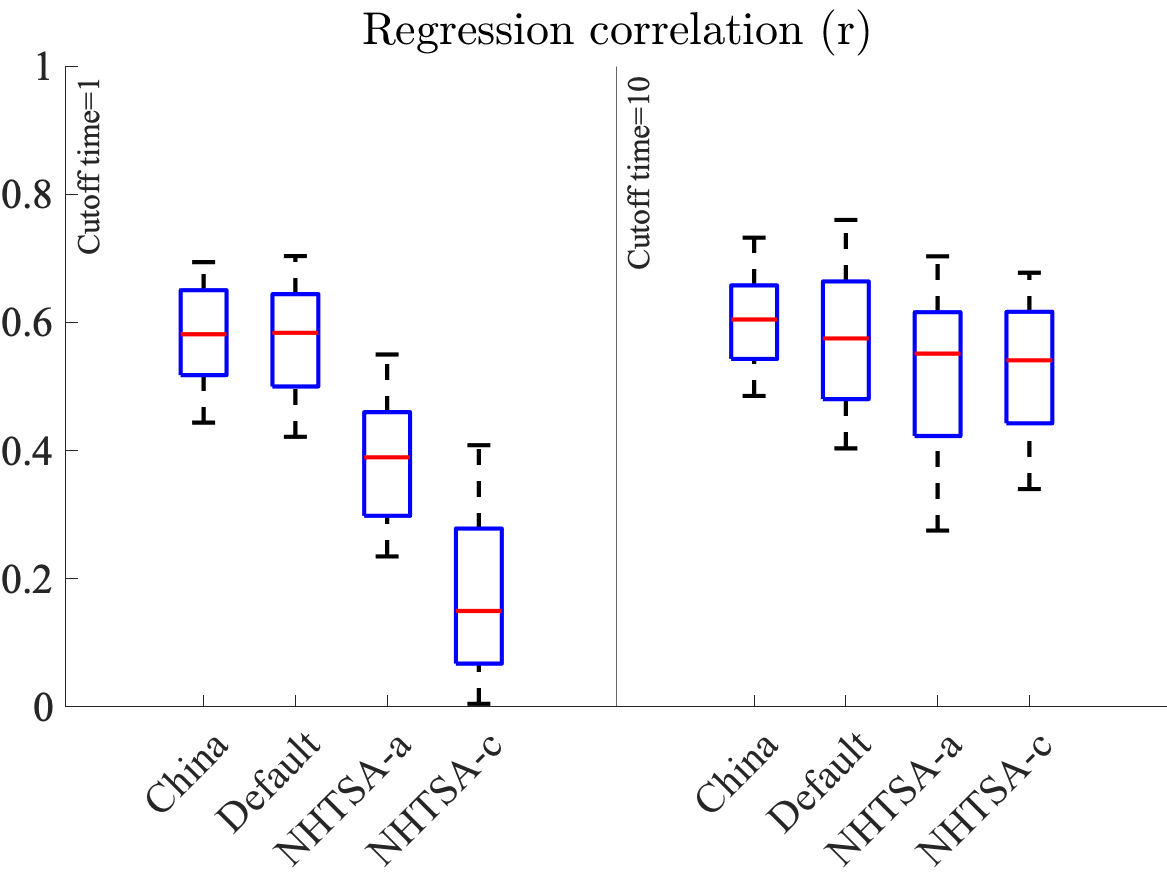
We now have improved correlations for the combined metric for both data regimes compared to the individual metrics alone. Note that we could improve this regression correlation even more by considering more sophisticated nonlinear combinations of the metrics (e.g. polynomials, Gaussian processes, neural networks, etc.). In this experiment the China and Default configurations show the best performance. In the next experiment, we will see which of the configurations work best for predicting crashes.
Experiment 3: Predicting crashes
Another way to understand the performance of RSS is to evaluate the internal metrics as features input to an early warning system, which would alert an AV that a crash may be imminent. The detection algorithm we propose is based on RSS Safe Percent, and it works as follows:
Danger Detector: in the 4 second time window leading up to the min-TTC event, find the first 1 second sub-window such that x% of the sub-window is considered unsafe by RSS (we’ll vary the number x between 0% and 100% in the experiments below).
Figure 5 shows how long before the min-TTC event the Danger Detector was able to warn us of an upcoming dangerous event (defined as min-TTC < 0.2s). We see that NHTSA-c has the earliest detection at 3s before a crash, whereas China ITS has the latest detection, with an average of 0.95s before a crash.
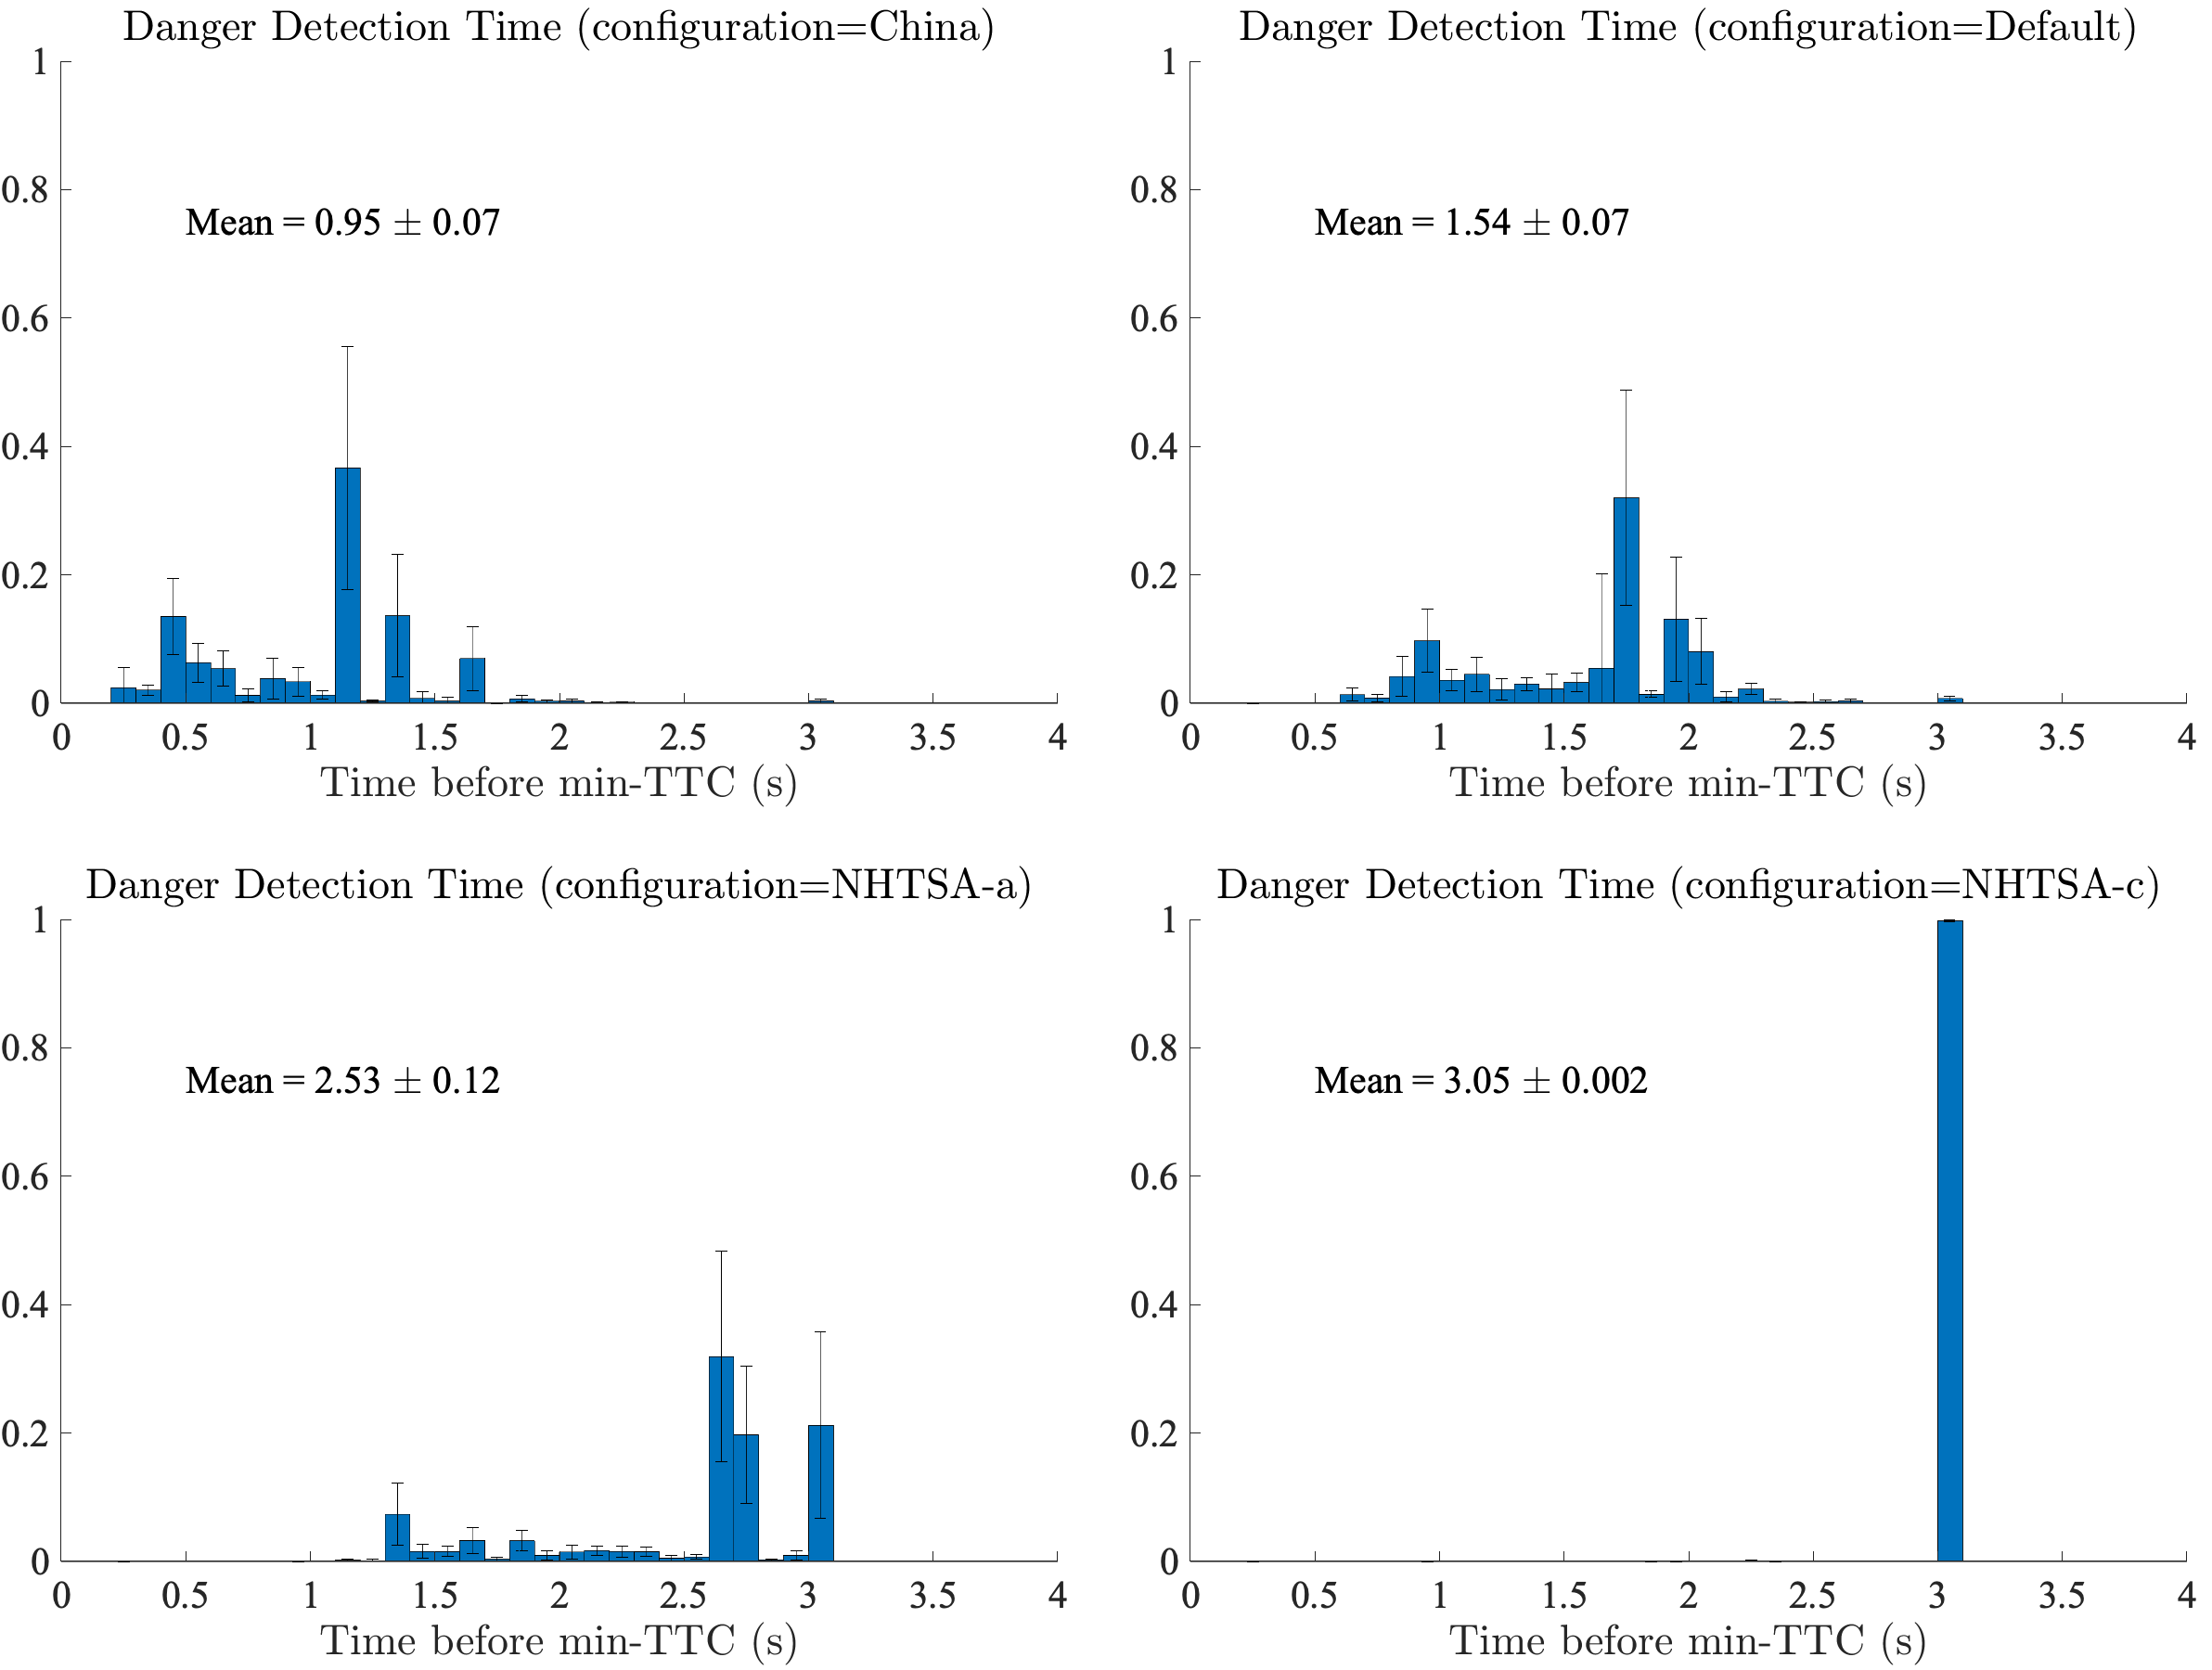
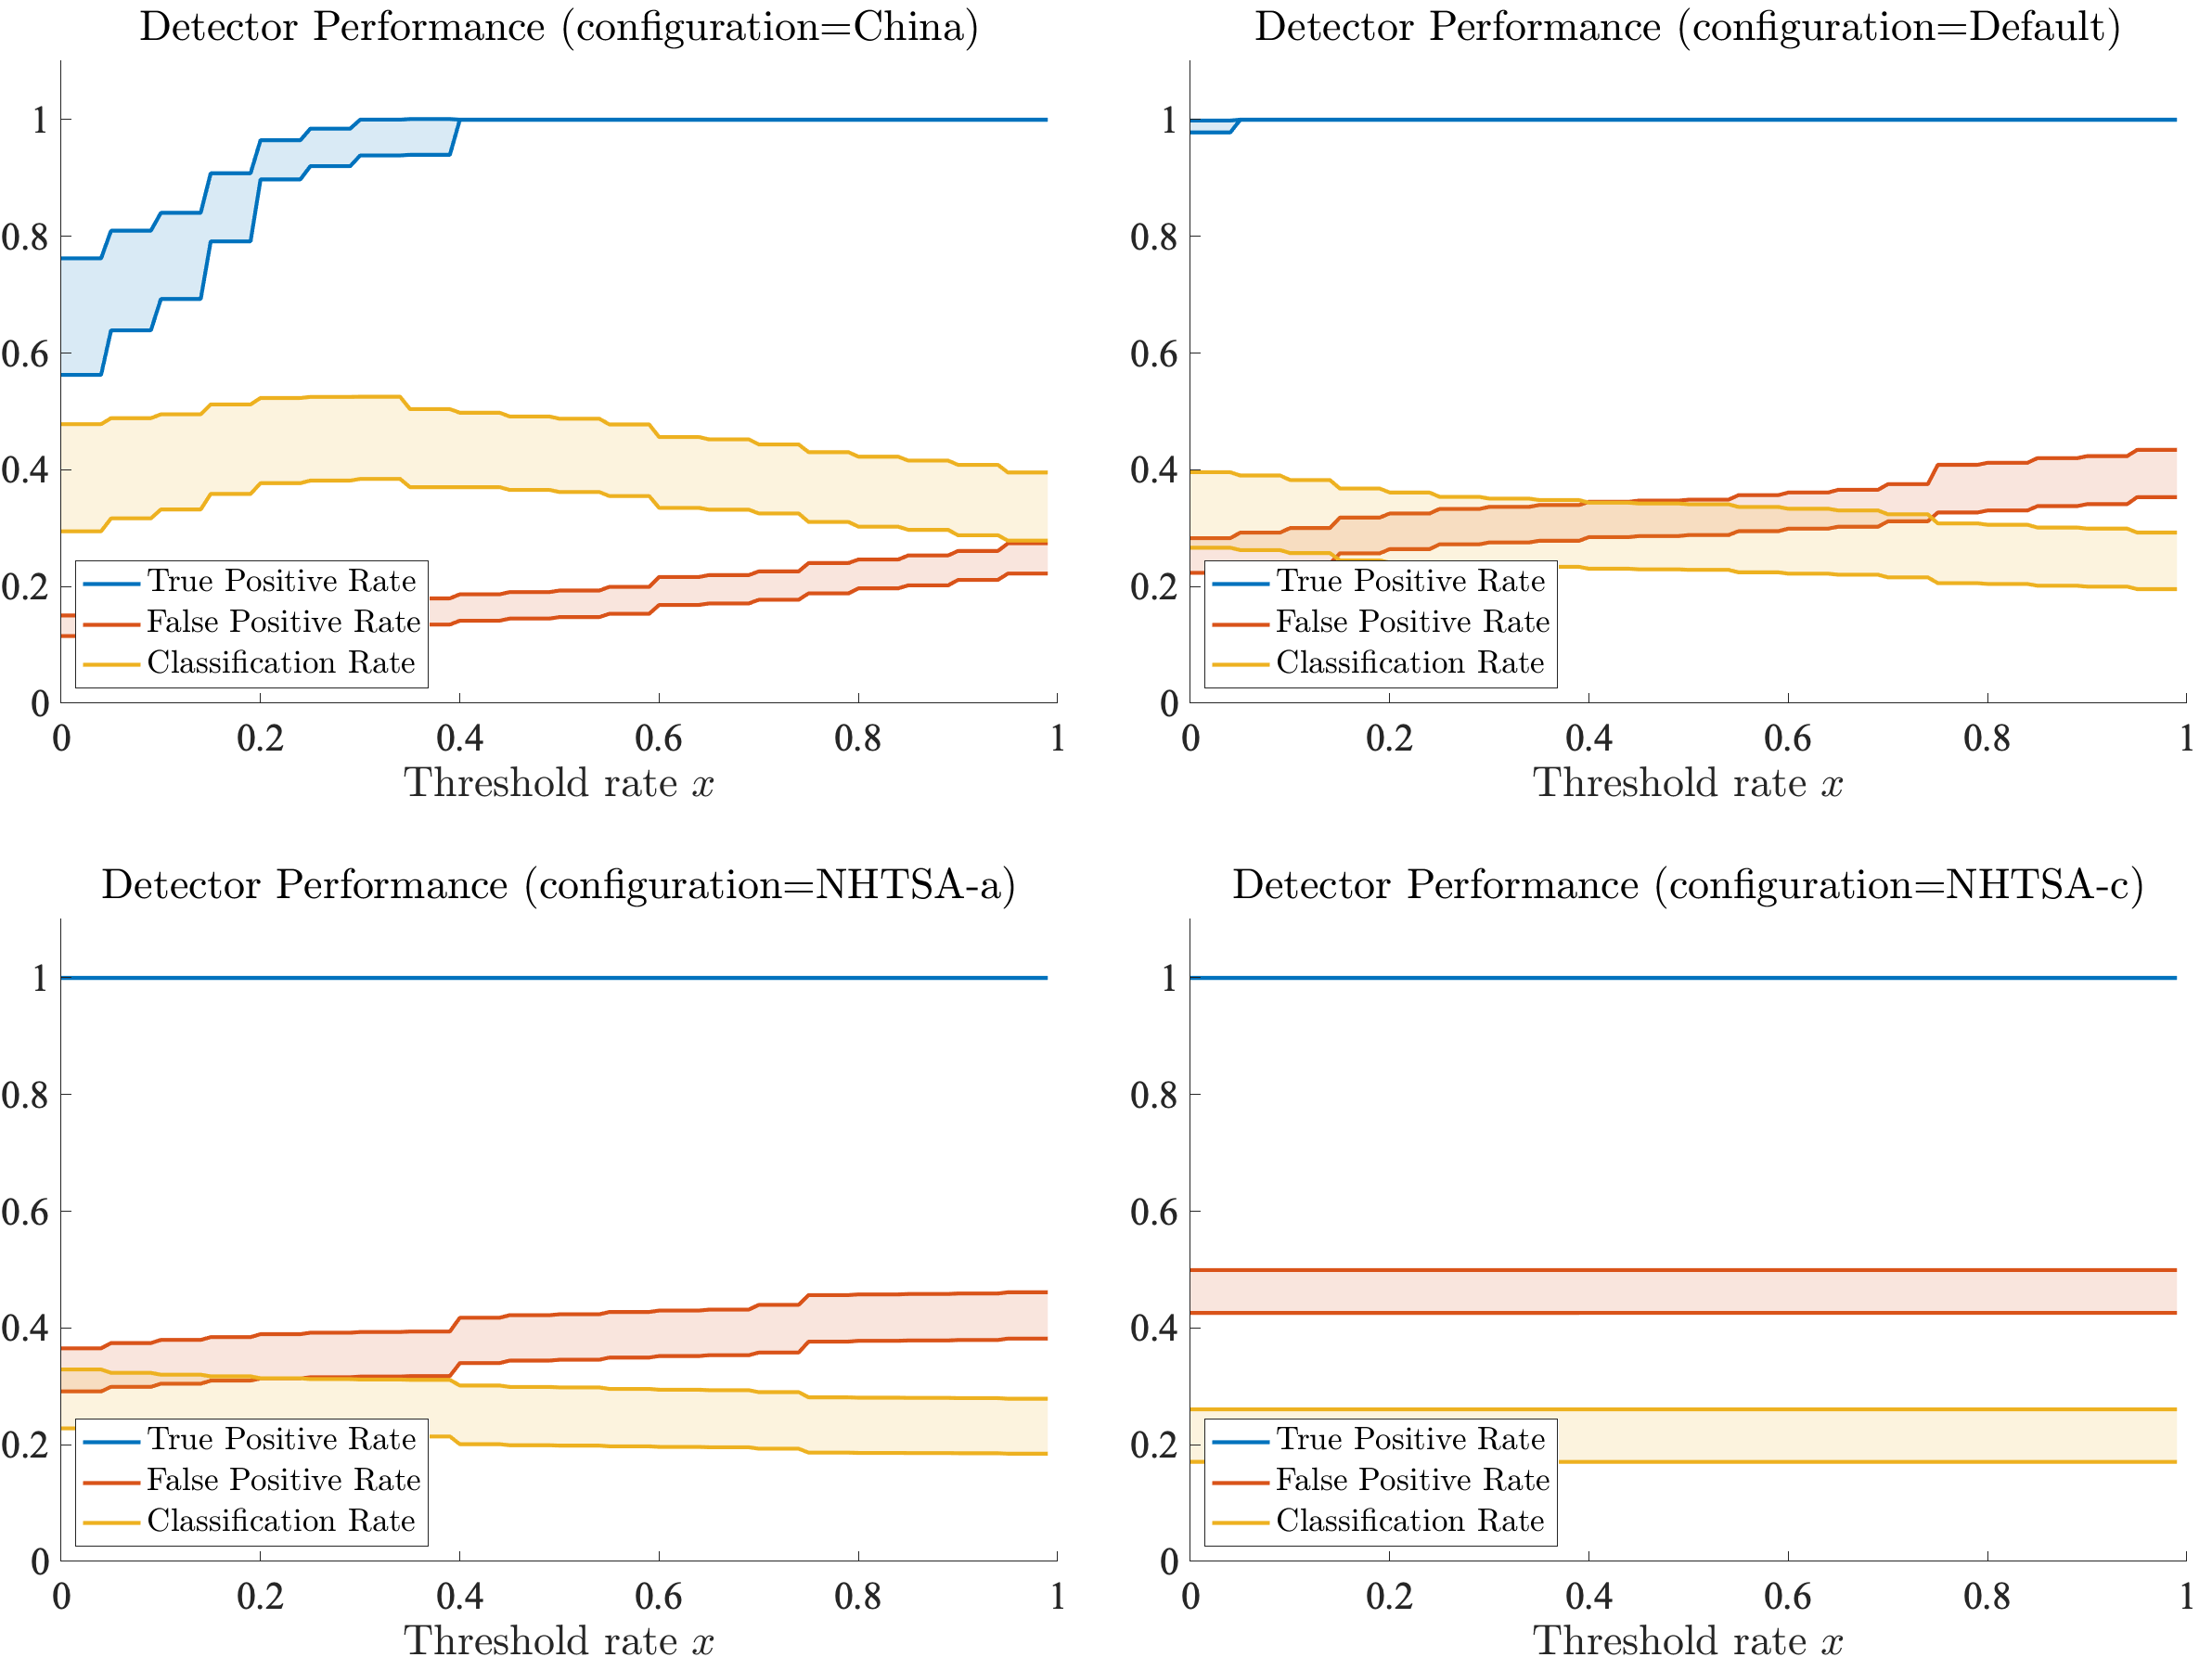
But earliest detection is not the whole story. As we discussed above, we want a detector that has good safety (early detection) as well as good performance (no false alarms). So NHTSA-c definitely beats the other metrics in detecting crashes and detecting them earlier than the other configurations, but what if it also has lots of false alarms?
To measure the balance of safety with performance, let’s take a look at the classification rate of the detector in predicting crashes: the probability that a crash occurs given that the detector fired. It turns out that we can compute the classification rate using the false alarm rate and true detection rate along with the rate of crashes in the dataset (via Bayes’ theorem). Figure 6 shows the classification rate, false positive (aka false alarm) rate, and the true positive rate. We see that the false alarm rate is so high for NHTSA-c that its classification rate suffers. Meanwhile, the China ITS configuration has the best combination of true detections and false alarms that give it the highest classification rate at roughly 40%.
Conclusions
In this blog post, we demonstrated quantitative tools for evaluating safety metrics. Key to our analysis was the development of a rich dataset containing a robust sampling of situations for the particular AV stack we were studying in the operational domain of interest. Normally, this is a tough problem since crashes are rare. We efficiently made this dataset using the TrustworthySearch API, which is designed to speed up the process of finding and simulating low-probability events such as crashes.
Creating curated datasets for safety analysis is just one of the benefits of the TrustworthySearch API and the other tools we develop at Trustworthy AI. Reach out to us for more information on how major AV developers, insurers, and regulatory bodies are working with us to help deliver the promise of autonomous vehicles.
References
- Albert, J., “Sabermetrics: The Past, the Present, and the Future,” Mathematics and Sports 43, 2010.
- Bailey, L. Scott. “1891 Lambert a New Claim for America’s First Gasoline Automobile.” Antique Automobile 24.5, 1960.
- Gassmann, B., et al., “Towards Standardization of AV Safety: C++ Library for Responsibility Sensitive Safety,” IEEE Intelligent Vehicles, 2019.
- Hakes, J., Sauer, R., “An Economic Evaluation of the Moneyball Hypothesis,” Journal of Economic Perspectives, 2006.
- Hawkins, A., “Everyone hates California’s self-driving car reports,” The Verge, 2020.
- Hayward, J., “Near-miss Determination through use of a Scale of Danger,” Pennsylvania Transportation and Traffic Safety Center, 1972.
- Nister, D., Lee, H., Ng, J., Wang, Y., “The Safety Force Field,” NVIDIA Technical Report, 2019.
- Shalev-Shwartz S., Shammah, S., Shashua A., “On a Formal Model of Safe and Scalable Self-driving Cars,” ArXiv, 2017.
- Weast, J., Elli, M., and Alvarez, I., “To Err Is Human: The Role of Human Derived Safety Metrics in an Age of Automated Vehicles,” SAE Technical Paper, 2021.
- Wishart, J. et al., “Driving Safety Performance Assessment Metrics for ADS-Equipped Vehicles,” SAE Technical Paper, 2020.
- Xu, X., et al., “Calibration and evaluation of the Responsibility-Sensitive Safety model of autonomous car-following maneuvers using naturalistic driving study data,” Transportation Research, 2021.